


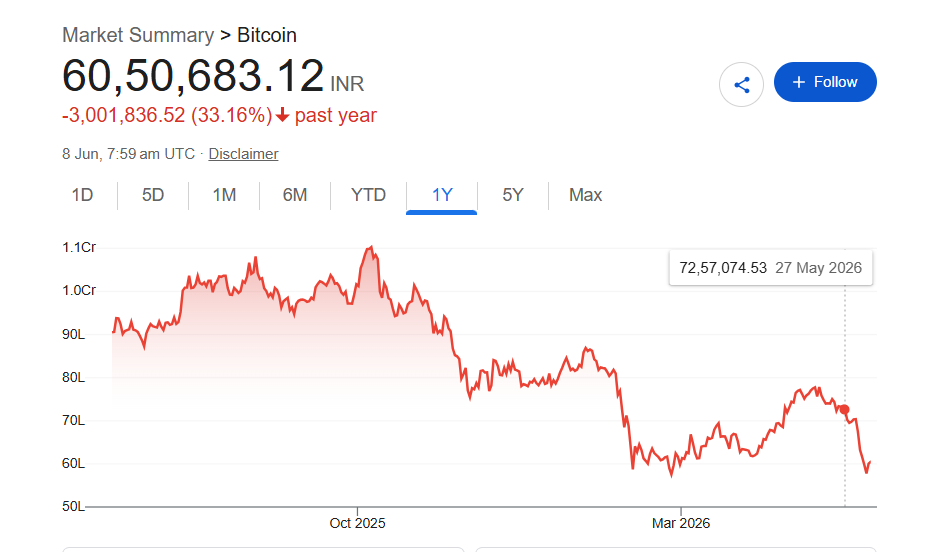
The cryptocurrency market is attempting to find its footing after a volatile trading weekend. Bitcoin (BTC) staged a noticeable recovery on Monday, climbing back toward the $62,850 mark (approximately Rs. 60.1 Lakh) after suffering a steep 13.95% drop over the previous 24 hours.
As buyers step in to scoop up digital assets at discounted rates, institutional anxiety surrounding continuous exchange-traded fund (ETF) liquidations keeps a tight lid on massive bullish breakouts.
The Macro Picture: Why Did Crypto Sink ?
The latest market correction didn’t happen in a vacuum. A series of macroeconomic shifts and changing institutional trends have simultaneously put pressure on high-risk digital assets:
- Sticky Interest Rates: A unexpectedly robust US labor market has reinforced projections that the Federal Reserve will likely maintain a restrictive monetary policy stance for longer. This routinely triggers sell-offs across speculative assets.
- The AI Capital Rotation: Institutional players are shifting focus. Market desks report that over $3 Billion (approx. Rs. 28,683 Crore) has systematically exited US spot Bitcoin ETFs recently, with capital rotating aggressively into high-performing Artificial Intelligence (AI) stocks and upcoming tech IPOs.
- Macro Data Hesitation: Traders remain highly cautious ahead of upcoming US inflation data indices, which will ultimately dictate the Federal Reserve’s next policy trajectory.
Also read : Samsung Galaxy S27 Pro Leaks: The “Ultra” Killer Samsung Hid From Us
Altcoins Mirror Choppy Stabilization
While Bitcoin fights to establish dominance above its baseline support levels, major altcoins are flashing mixed signals across domestic and global spot exchanges.
| Crypto Asset | Global Trading Price | Approx. Indian Price (INR Equivalent) | Market Sentiment Profile |
| Bitcoin (BTC) | $62,850 | Rs. 59.7 Lakh | Defending key structural support levels. |
| Ethereum (ETH) | $1,660 | Rs. 1.57 Lakh | Trapped underneath the critical $2,000 ceiling. |
| Binance Coin (BNB) | $595.13 | Rs. 56,900 | Trading flat with muted retail buying momentum. |
| Solana (SOL) | $65.43 | Rs. 6,260 | Showing relative weakness under broader ecosystem pressure. |
| XRP | $1.13 | Rs. 108 | Exhibiting sideways accumulation patterns. |
| Dogecoin (DOGE) | $0.085 | Rs. 8.1 | High risk-averse behavior across large-cap meme assets. |
Technical Indicators Hint at a Historic Rebound
Despite the heavy outflows, technical analysts are pointing out a major historical buy signal hiding inside the charts.
The recent aggressive sell-off pushed Bitcoin’s daily Relative Strength Index (RSI)-a popular metric tracking whether an asset is overbought or oversold-down to 15.5. This marks one of the most heavily oversold conditions seen since the historic global market crash of March 2020.
Historical Precedent: Similar rock-bottom RSI levels recorded in March 2020 and February 2026 served as springboards for immediate trend reversals, yielding subsequent price surges of roughly 50% and 30% respectively. If historical fractal patterns repeat, analysts note Bitcoin could theoretically target the $80,000 zone in the upcoming quarters.
Crucial Levels to Watch Moving Forward
On-chain metrics provide a silver lining: long-term asset holders are notably refusing to panic-sell, preserving a strong underlying market floor. Moving deeper into the trading week, the crypto ecosystem’s next directional trend depends on two key price boundaries:
- The Support Floor: Bitcoin must successfully hold its ground within the $60,000 to $62,000 zone to prevent a secondary capitulation wave.
- The Bullish Trigger: To reclaim definitive macro control, bulls must consistently push and close prices above the $65,000 to $66,000 resistance barrier.
Disclaimer: Cryptocurrency investments are highly volatile, completely unregulated, and subject to structural market risks. Ensure you conduct thorough independent research before deploying capital.